The fat zero affected columns can be seen in the 2 dimensional images images as vertical stripes with (usually) lower level than the background.
This phenomenon was investigated using the dome flats used for the linearity test (with levels in the range 22 - 58437 ADU) and an extra sequence of dome flats with very low levels (with levels in the range 1 - 48 ADU). The very low level dome flats are dfsc2597-2616, from night 13 (filter: Johnson B). These were also corrected for bias, dark current, and shutter effect.
We have the following 3 sequences of images:
These 32 images were now made 1 dimensional by averaging in the y-dimension using blkavg. This is because the fat zero effect only varies from column to column (x), not from line to line (y).
To find the columns affected by fat zero, the following was done: All the exposures in sequence 1 and all the non 10 sec exposures in sequence 2 was divided by the 10 sec exposure from sequence 2, and all the non 10 sec exposures in sequence 3 was divided by the 10 sec exposure from sequence 3. Since the 10 sec exposure from sequence 2 were made from 18 images, and the one from sequence 3 from 10 images, they both had better signal-to-noise (S/N) than the other ones.
If we did not have any fat zero columns, the plot of the quotients should be flat (within the noise and cosmic-ray-events), since the flat field pattern (which also is seen even in the 1 dimensional images) is divided out. By inspecting the 30 (10+12+8) quotient plots, 44 fat zero column candidates were noted. The columns were in 6 ``locations'', with each location having a number of fat zero columns next to each other.
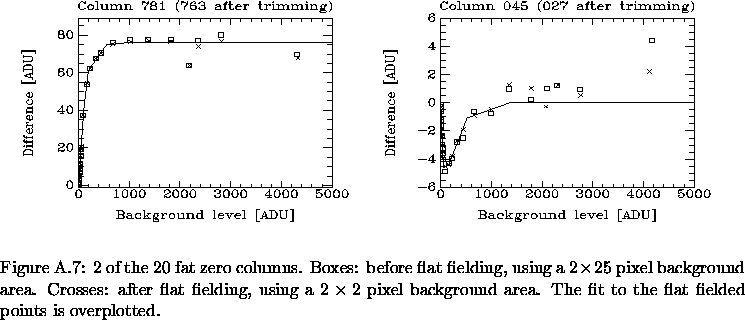
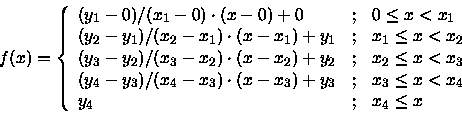
The fat zero effect as function of the level in the non-affected neighbor column was now measured as follows: In a 25 pixel wide area on each side of the given fat zero location the median value was calculated, and the mean of these 2 medians was defined as the background level. The level in each of the suspected fat zero columns together with the level in a test column on each side was measured, and the difference between the background level and the level in the given column calculated. This procedure is implemented in the cl-script calc_fatzero.
If the images had been flat fielded, the plot of a non fat zero column
would be flat and zero (diff = 0![]() background).
When not flat fielded, one gets a straight line (diff =
background).
When not flat fielded, one gets a straight line (diff = ![]() background).
background).
In the case of a fat zero column, one does not get a straight line,
but a more complicated non-linear behavior.
If the image has not been flat fielded, there might be a flat field
effect of the form diff = ![]() background superimposed,
which will show up at high levels.
Two examples are shown in Figure
background superimposed,
which will show up at high levels.
Two examples are shown in Figure ![]() .
.
The plot similar to the ones shown in Figure ![]() were investigated for the 44 fat zero column candidates.
Of these, 20 were actually fat zero columns with an effect > 1 ADU.
The 20 columns are listed in Table
were investigated for the 44 fat zero column candidates.
Of these, 20 were actually fat zero columns with an effect > 1 ADU.
The 20 columns are listed in Table ![]() .
.
| Notes: The column numbers are in the untrimmed frame, after trimming subtract 18 pixels. |
It was not possible to find any simple analytical function that fitted
the fat zero effect as function of the background level,
so it was decided to use the following piecewise linear function
The actual fitting was done using the task nfit1d, which uses least squares fitting implemented by a downhill simplex minimization algorithm (``amoeba'').
In some cases we decided, that the asymptotic level should be zero
(i.e. y4=0),
even though when fit y4 might not turn out to be zero.
An example is column 045, shown in Figure ![]() .
.
The method requires an initial guess on the free parameters (xi,yi). The problem is not very well constrained, and is therefore quite sensitive to the initial conditions. Nevertheless, it produces a quite good fit, with lower residuals than the initial guess.
A cl-script b_fatzero was written.
This procedure corrects a 2 dimensional image for the fat zero effect
in the 20 columns, using equation (![]() ) and the
corresponding
) and the
corresponding
![]() coefficients.
The background level is determined locally, i.e. it is not the same for the
entire column.
coefficients.
The background level is determined locally, i.e. it is not the same for the
entire column.
We wanted to have our images flat fielded before we determined the fat zero correction. However, we could not make any flat fields as long as we were not able to correct for fat zero. Therefore, the above determination of the fat zero effect on the non flat fielded images is only a first approximation. We can now use this to make fat zero corrected flat fields, which we can then use to flat field our images, after which we can get a second approximation to the fat zero effect.
The 10 JB dome flats dfsc1670-1679 (night 4) and the 10 GR dome flats dfsc1808-1817 (night 5) were corrected for bias, dark, shutter, and fat zero as determined from the first iteration as mentioned above, and then combined. The two 2 dimensional images (using the same section as the fat zero images) were made 1 dimensional, and the 32 1 dimensional fat zero images were then flat fielded.
Now the measuring of the fat zero effect using calc_fatzero could be repeated, this time using areas for background level determination only 2 pixels wide (this is the width we want to use for the science images).
Hereafter, the fat zero functions could be fitted again.
As seen in Figure ![]() , the change from
no flat fielding and 25 pixel background areas
to flat fielding and 2 pixel background areas is not that big
on small levels (< 5000 ADU). On larger levels (up to 65000 ADU),
a bigger difference can be seen, with the flat fielded images indeed
being more flat that the non flat fielded images.
, the change from
no flat fielding and 25 pixel background areas
to flat fielding and 2 pixel background areas is not that big
on small levels (< 5000 ADU). On larger levels (up to 65000 ADU),
a bigger difference can be seen, with the flat fielded images indeed
being more flat that the non flat fielded images.
b_fatzero was updated to use the new coefficients. The maximum correction for the 20 columns ranges from 1 to 76 ADU).
Properties of E and S0 Galaxies in the Clusters HydraI and Coma
Master's Thesis, University of Copenhagen, July 1997![]()
Bo Milvang-Jensen (milvang@astro.ku.dk)