The level used before (e.g. in Figure ![]() ) was computed
using imstat with a suitable upper cut to avoid cosmic-ray-events.
To get more precise level, fitsky was used.
This task fits a Gaussian to the histogram of the sky values
and determines the mean level from the fit.
The center area was defined as
(x,y) = (500,200), and the right hand side
area as
(x,y) = (995,300), both with an inner radius (annulus) of
2.5 pixels and an outer radius (dannulus) of 40.0 pixels.
) was computed
using imstat with a suitable upper cut to avoid cosmic-ray-events.
To get more precise level, fitsky was used.
This task fits a Gaussian to the histogram of the sky values
and determines the mean level from the fit.
The center area was defined as
(x,y) = (500,200), and the right hand side
area as
(x,y) = (995,300), both with an inner radius (annulus) of
2.5 pixels and an outer radius (dannulus) of 40.0 pixels.
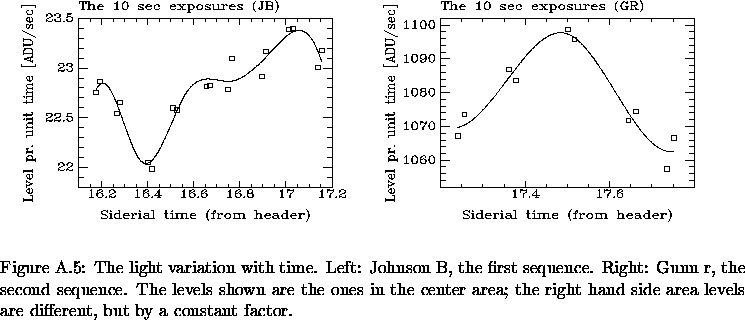
Since we have a number of images with the same exposure time
(10 sec, see Table ![]() ), we can check whether the
intensity really was constant by plotting the level versus the
(clock) time.
This is shown in Fig.
), we can check whether the
intensity really was constant by plotting the level versus the
(clock) time.
This is shown in Fig. ![]() .
It is seen that the illumination level was not constant.
.
It is seen that the illumination level was not constant.
The points shown in Figure ![]() were fitted with a
5 piece (JB) / 2 piece (GR) cubic spline using gfit1d,
as also shown in the figure.
were fitted with a
5 piece (JB) / 2 piece (GR) cubic spline using gfit1d,
as also shown in the figure.
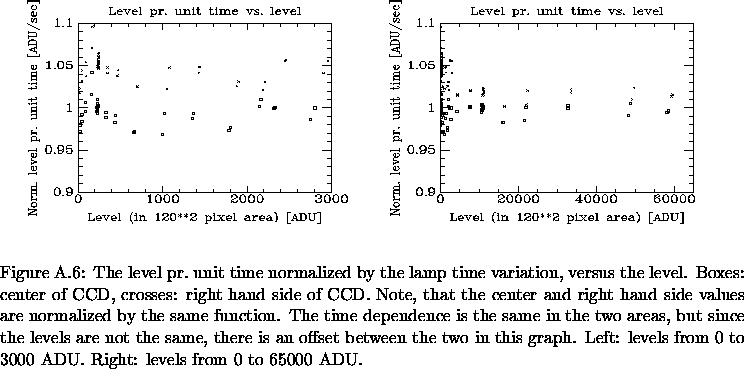
All the N/t values for the 68 images were now divided by the
fit to the time variation. Now N/t vs. t could be plotted,
as shown in Figure ![]() .
.
As Figure ![]() shows, the CCD is in fact linear up to the
very highest levels.
shows, the CCD is in fact linear up to the
very highest levels.
The rms standard deviation of all the data with levels > 100 ADU is
1.1%. The rms for the first sequence (JB) and the second sequence (GR)
separately, is 1.4% and 0.7%, respectively.
The reason for the difference is probably the more ill-behaved lamp
variation for the first sequence, as seen in Figure ![]() .
We conclude, that the CCD is linear within 0.7%.
.
We conclude, that the CCD is linear within 0.7%.
Properties of E and S0 Galaxies in the Clusters HydraI and Coma
Master's Thesis, University of Copenhagen, July 1997![]()
Bo Milvang-Jensen (milvang@astro.ku.dk)