Next: 12. Data for the
Up: 11. The Standard Calibration
Previous: 11.4 The Standard Catalog
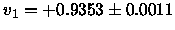
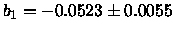
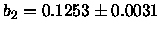
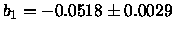
11.5 The Transformation Equations
The following transformation equations were used:
| rstd |
= |
rinst + r1 + r2 (B-r)inst |
(11.11) |
| Vstd |
= |
Vinst + v1 + v2 (B-V)inst |
(11.12) |
| Bstd |
= |
Binst + b1 + b2 (B-r)inst |
(11.13) |
| Ustd |
= |
Uinst + u1 + u2 (U-B)inst |
(11.14) |
``std'' denotes standard magnitudes, and ``inst'' denotes instrumental
magnitudes.
The fitting of the variables in the transformation equations to the data
was done using the task fitparams (in digiphotx.photcalx).
At the very first it was tried to use transformation equations without a
color term (i.e. with the subscript 2 variables set to zero).
The rms scatter was so large, that it was concluded that a
color term was needed. As will be seen in the following,
the resulting color coefficients
are indeed significantly different from zero at the 3 sigma level.
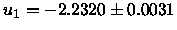
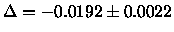
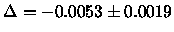
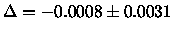
fitparams was run 3 times for the 4 filters:
- 1.
- On all the stars, focused and defocused, with the color term
coefficient as a free variable.
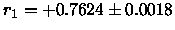
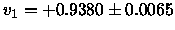
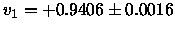
Plots showing
mstd-minst vs. instrumental color
for the data points and the resulting fit
are in Figure
![[*]](http://www.astro.ku.dk/Icons/latex2html-96.1/cross_ref_motif.gif) -.
Note, that the aspect ratio of the 4 figures is the same,
-.
Note, that the aspect ratio of the 4 figures is the same,
 ,
so the color dependence can easily
be compared.
,
so the color dependence can easily
be compared.
- 2.
- On the focused stars only, with the color term coefficient fixed
to the value from fit .
- 3.
- On the defocused stars only, with the color term coefficient fixed
to the value from fit .
In all 3 fitting series,
a number of stars were deleted (i.e. excluded from the fit) all together,
that is, all the observations of the given star were deleted.
These stars are listed in Table .
They were deleted for a number of different reasons:
-
3 stars (PG1633+099, M67-F81, & SA110-502)
were deleted because they were either very blue
((B-V)std
 mag)
or red ((B-V)std
mag)
or red ((B-V)std  2.3 mag).
Since we only need a transformation which is valid for the color range of
E/S0 galaxies, say (B-V)std = 0.75-1.1 mag
(Jørgensen, private communication),
this is perfectly justifiable.
The remaining stars still span a sufficient range in (B-V)std,
from 0.1 (M67-F153) to 1.2 (SA110-504).
2.3 mag).
Since we only need a transformation which is valid for the color range of
E/S0 galaxies, say (B-V)std = 0.75-1.1 mag
(Jørgensen, private communication),
this is perfectly justifiable.
The remaining stars still span a sufficient range in (B-V)std,
from 0.1 (M67-F153) to 1.2 (SA110-504).
-
1 star (M67-F117)
was deleted (in the Gunn r and Johnson V fits only)
because it had a large scatter, i.e. the individual
observations of this star were very scattered.
This can be seen in
Figure for Gunn r,
and Figure for Johnson V.
The reason for this was not further investigated.
-
3 stars (M67-F108, M67-F105, & M67-F141)
were deleted (in the Gunn r and Johnson V fits only) because they
deviated systematically from the fit.
This can be seen in
Figure for Gunn r,
and Figure for Johnson V.
These stars were the reddest and brightest of the defocused stars.
The important question is, whether it is only these reddest and brightest
defocused stars that behave differently, or if they are just the most
extreme cases of a general trend that the focused and the defocused stars do
not behave in the same way.
Table:
Deleted stars
| Star |
Deleted in |
(B-r) |
(B-V) |
(U-B) |
(B-V) |
r |
V |
Reason for deletion |
| |
GR |
JV |
JB |
JU |
instrumental, [mag] |
standard, [mag] |
|
| PG1633+099 |
x |
x |
x |
x |
0.24 |
0.87 |
1.26 |
-0.2 |
14.8 |
14.4 |
Very blue |
| M67-F81 |
x |
x |
x |
x |
0.41 |
0.95 |
1.88 |
-0.1 |
10.4 |
10.0 |
Very blue |
| SA110-502 |
x |
x |
x |
x |
3.96 |
3.02 |
4.86 |
2.3 |
11.4 |
12.3 |
Very red |
|
M67-F117 |
x |
x |
|
|
1.69 |
1.69 |
|
0.8 |
12.5 |
12.6 |
Large scatter |
|
M67-F108 |
x |
x |
|
|
2.44 |
2.16 |
|
1.4 |
9.3 |
9.7 |
Large res., bright |
| M67-F105 |
x |
x |
|
|
2.28 |
2.07 |
|
1.2 |
10.0 |
10.3 |
Large res., bright |
| M67-F141 |
x |
x |
|
|
2.05 |
1.94 |
|
1.1 |
10.2 |
10.4 |
Large res., bright |
|
In addition, individual observations with uncertainties larger than 0.1 mag
were deleted. This was only the case for Johnson U, for 9 data points,
of which 4 belonged to SA110-502, which would have been deleted anyway.
Also individual deviating observations were deleted.
This also was only the case for Johnson U, for 3 data points.
The result from the 3 series of fit are shown in Table .
Table:
Transformation equation coefficients
| Type |
Zero point [mag] |
Color term |
Scatter [mag] |
| all |
 |
 |
rms = 0.0185 |
| foc |
 |
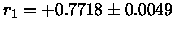
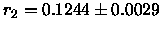
r2 = 0.1244 (fixed) |
rms = 0.0124 |
| def |
 |
r2 = 0.1244 (fixed) |
rms = 0.0187 |
| all |
 |
 |
rms = 0.0144 |
| foc |
 |
v2 = 0.0861 (fixed) |
rms = 0.0164 |
| def |
 |
v2 = 0.0861 (fixed) |
rms = 0.0117 |
| all |
 |
 |
rms = 0.0219 |
| foc |
 |
b2 = 0.1253 (fixed) |
rms = 0.0291 |
| def |
 |
b2 = 0.1253 (fixed) |
rms = 0.0139 |
| all |
 |
 |
rms = 0.0390 |
| foc |
 |
u2 = 0.0187 (fixed) |
rms = 0.0461 |
| def |
 |
u2 = 0.0187 (fixed) |
rms = 0.0256 |
Notes:
``all'': all stars fitted, color term free.
``foc'': only focused stars fitted, color term fixed.
``def'': only defocused stars fitted, color term fixed.
The ``all'' coefficients are the final ones, i.e. the ones used to
standard calibrate the surface photometry.
|
The reason for fitting the focused and defocused stars separately
with forced same color dependence, was to be able to compare their zero points.
These zero point differences are shown in Table .
There is a zero point difference in Gunn r at the 9 sigma level,
and a zero point difference in Johnson V at the 3 sigma level.
Table:
Zero point differences
| Zero point def [mag] |
Zero point foc [mag] |
Zero point difference [mag] |
|
|
|
 (8.7
(8.7 ) ) |
|
|
|
 (2.8)
(2.8) |
|
|
|
 (0.3)
(0.3) |
|
|
|
 (1.5)
(1.5) |
Notes: ``def'' denotes the defocused stars, ``foc'' denotes the focused stars.
``Zero point difference'' is defined as ``Zero point def'' minus
``Zero point foc''.
|
That the focused and defocused stars behave differently in Gunn r and
Johnson V can be seen in
Figure and and Figure .
The question is what kind of difference it is.
The figures could indicate, that it is not only a zero point difference,
but also a difference in color dependence.
However, the rms scatter when fitting all the stars together
(with the deletions previously mentioned) is still sufficiently low,
less than 0.02 mag in both Gunn r and Johnson V.
The conclusion is, therefore, to accept the result of the fit of all the
stars together (Table ),
and then to watch out for small differences in the
derived galaxy magnitudes when compared with literature values.
Table:
Adopted transformation equation coefficients
| Zero point [mag] |
Color term |
Scatter [mag] |
|
|
|
rms = 0.0185 |
|
|
|
rms = 0.0144 |
|
|
|
rms = 0.0219 |
|
|
|
rms = 0.0390 |
Notes:
These are the ``all'' coefficients from Table ,
listed here alone for convenience.
|
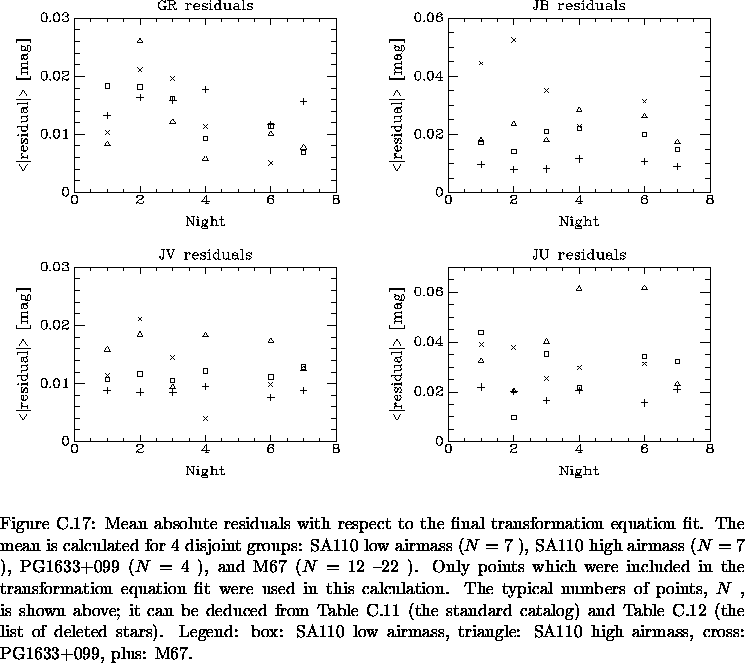
Finally, we can check if the stars from night 4 and 6 have larger
residuals than the stars from the other nights.
Figure shows mean absolute residual for the 3 fields,
with the SA110 field split up into the low and the high airmass observations.
No such difference is seen, except for the SA110 high airmass observations
in Johnson U,
but it might not be significant due to the large random scatter
of the data in this filter.
Otherwise, these plots do not show any correlations with night and
field/airmass,
except that the night 2 and 3 residual in Gunn r are somewhat higher.
The conclusion is still that the standard transformation we have arrived at
is acceptable.
Next: 12. Data for the
Up: 11. The Standard Calibration
Previous: 11.4 The Standard Catalog
Properties of E and S0 Galaxies in the Clusters HydraI and Coma
Master's Thesis, University of Copenhagen, July 1997

Bo Milvang-Jensen (milvang@astro.ku.dk)
![\begin{figure}% latex2html id marker 25005\makebox[\textwidth]{
\epsfxsize=13....
...ot deleted,
cross: focused \& deleted, plus: defocused \& deleted.
}\end{figure}](img1022.gif)
![\begin{figure}% latex2html id marker 25013\makebox[\textwidth]{
\epsfxsize=13....
...ot deleted,
cross: focused \& deleted, plus: defocused \& deleted.
}\end{figure}](img1023.gif)
![\begin{figure}% latex2html id marker 25021\makebox[\textwidth]{
\epsfxsize=13....
...ot deleted,
cross: focused \& deleted, plus: defocused \& deleted.
}\end{figure}](img1024.gif)
![\begin{figure}% latex2html id marker 25029\makebox[\textwidth]{
\epsfxsize=13....
...ot deleted,
cross: focused \& deleted, plus: defocused \& deleted.
}\end{figure}](img1025.gif)