The observations we normally have at hand of E and S0 galaxies are direct images and longslit spectroscopy along the major axis. Only for very nearby galaxies and with superb instrumentation (e.g. with the Hubble Space Telescope) it is possible to resolve the galaxy into individual stars; in all other cases only the integrated light of the stellar population of the galaxy can be observed.
For each galaxy,
we want to determine a characteristic size and surface brightness,
and the luminosity (or the total magnitude).
This is in the following done by first
fitting ellipses to the images of the galaxies.
The resulting surface photometry yields among other things
the local surface brightness ![]() as function of projected radius r (in arcsec).
as function of projected radius r (in arcsec).
![]() is expressed in units of
magnitudes per square arc second (
is expressed in units of
magnitudes per square arc second (
![]() ),
and r is calculated as
),
and r is calculated as
![]() ,
where a and b are the
semi-major and semi-minor axes of the elliptical isophote, respectively.
The surface photometry for the HydraI galaxies is described
in Chapter
,
where a and b are the
semi-major and semi-minor axes of the elliptical isophote, respectively.
The surface photometry for the HydraI galaxies is described
in Chapter ![]() .
.
Elliptical galaxies
are in general well described by the r1/4 law
(de Vaucouleurs 1948),
The constant in Eq. (![]() ) has been chosen so that
half the light of the galaxy is inclosed within
) has been chosen so that
half the light of the galaxy is inclosed within
![]() .
When
.
When
![]() has been determined,
the mean surface brightness within
has been determined,
the mean surface brightness within
![]() ,
denoted
,
denoted
![]() ,
can be calculated.
From
,
can be calculated.
From
![]() and
and
![]() the total magnitude can be calculated as
the total magnitude can be calculated as
![]() ),
since
),
since
![]() is the surface within which half the light is found.
The derivation of
global photometric parameters
for the HydraI galaxies is described
in Chapter
is the surface within which half the light is found.
The derivation of
global photometric parameters
for the HydraI galaxies is described
in Chapter ![]() .
.
The surface brightness
can be expressed in
![]() instead of
instead of
![]() ,
where
,
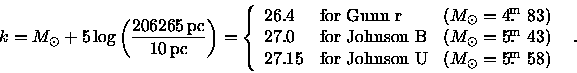
where ![]() is the luminosity of the Sun
in the given passband (e.g. Gunn r).
This is done as
is the luminosity of the Sun
in the given passband (e.g. Gunn r).
This is done as
 |
(2.3) |
From the spectroscopy we can obtain a measure of the kinetic energy
of the galaxy, namely the line-of-sight velocity dispersion of
the stars in the galaxy,
![]() .
.
We determine
the strength of different individual absorption lines from the spectroscopy.
Due to moderate spectral resolution and velocity broadening
it is not possible to determine accurate equivalent widths as in
high resolution spectroscopy of single stars.
Instead, a so-called line index is calculated from the
flux within an index passband centered on the spectral feature
relative to the level defined by a pseudocontinuum passband on
each side of the line.
We use the Lick/IDS line index system
(Faber et al. 1985, Worthey et al. 1994),
of which examples are
![]() and
and
![]() .
These indices will usually
depend strongly on the abundance of the element that gives rise to the
absorption feature on which they are centered.
But in addition, lines from other elements present in either the
index passband or in the pseudocontinuum passbands
will also have an effect.
In a few cases the indices will respond in very unexpected ways
to abundances changes.
For example, Tripicco & Bell (1995)
found the Fe4668 index to be very sensitive to the carbon abundance,
but almost insensitive to the iron abundance!
This index has later been renamed to C4668 or C24668.
The indices we use in this study are more `well-behaved',
cf. Sect.
.
These indices will usually
depend strongly on the abundance of the element that gives rise to the
absorption feature on which they are centered.
But in addition, lines from other elements present in either the
index passband or in the pseudocontinuum passbands
will also have an effect.
In a few cases the indices will respond in very unexpected ways
to abundances changes.
For example, Tripicco & Bell (1995)
found the Fe4668 index to be very sensitive to the carbon abundance,
but almost insensitive to the iron abundance!
This index has later been renamed to C4668 or C24668.
The indices we use in this study are more `well-behaved',
cf. Sect. ![]() .
In addition to element abundances the line indices are also sensitive to
the mean age
of the stellar population.
For the indices used in this study, namely
.
In addition to element abundances the line indices are also sensitive to
the mean age
of the stellar population.
For the indices used in this study, namely
![]() and
and
![]() ,
older ages give stronger absorption lines,
cf. Sect.
,
older ages give stronger absorption lines,
cf. Sect. ![]() .
Note, that this is not the case for the
.
Note, that this is not the case for the
![]() index.
We do not have
index.
We do not have
![]() indices for our samples.
indices for our samples.
This project is based on central spectroscopical values.
Because of the cost in observing time to get spatial
information in the the spectra there is a trade off between either having large
samples of galaxies with centrally measured parameters
or having much smaller samples with spatial
information in the spectra.
Further, this allows for the use of fiber-fed spectrographs.
Several studies have found tight correlations between
central quantities and more global quantities.
For example, Burstein et al. (1988)
and
Bender, Burstein, & Faber (1993)
found a tight correlation
between central
![]() and global (B-V) color.
Here `global' means within an aperture of 25 times larger diameter of that
used for the central values.
These authors concluded from this that
variations in radial gradients in colors and line indices
from galaxy to galaxy are small.
However, if the size of the gradient is correlated with the central value,
this conclusion does not necessarily hold.
We do not study radial gradients in colors and line indices
in this work.
and global (B-V) color.
Here `global' means within an aperture of 25 times larger diameter of that
used for the central values.
These authors concluded from this that
variations in radial gradients in colors and line indices
from galaxy to galaxy are small.
However, if the size of the gradient is correlated with the central value,
this conclusion does not necessarily hold.
We do not study radial gradients in colors and line indices
in this work.
From the spectroscopy the redshift z is determined.
The observations
are usually transformed from the observer's frame to some standard frame.
In this work we will use two frames:
(1) The heliocentric frame, in which the Sun is at rest.
(2) The CMB frame, which is the frame that is at rest relative to
the cosmic microwave (CMB) radiation,
i.e. the frame in which the CMB radiation is isotropic.
Redshifts in these two frames will be denoted
![]() and
and
![]() ,
respectively.
,
respectively.
The spectroscopy
for the HydraI galaxies is described
in Chapter ![]() .
.
Properties of E and S0 Galaxies in the Clusters HydraI and Coma
Master's Thesis, University of Copenhagen, July 1997![]()
Bo Milvang-Jensen (milvang@astro.ku.dk)
![\begin{displaymath}\mu(r) = \mu_{\rm e} +
8.3268 \left[ \left( \frac{r}{{r_{\rm e}}} \right)^{1/4} - 1 \right] \enspace ,
\end{displaymath}](img25.gif)