Eksempel på forskningsprojekt ved brug af det Virtuelle Observatorium: natriumabsorptionslinien i galakser
I forbindelse med en såkaldt
sommerskole for forskere om det Virtuelle Observatorium i 2008
(afholdt af det amerikanske nationale Virtuelle Observatorium, US NVO)
udførte Marcel Bergmannn & Bo Milvang-Jensen et forskningsprojekt som
anvendte forskellige værktøjer fra det Virtuelle Observatorium
til at studere natriumabsorptionslinien i galakser.
Projektet havde titlen:
"Is the Na D Absorption Line Useful for Integrated Light Stellar Population Studies in Galaxies?"
Projektet beskrives nedenfor.
Desuden er elektroniske overheads fra præsentationen af projektet på sommerskolen tilgængelige
(PDF eller Powerpoint).
Projektet blev sidenhen fremlagt på møde i American Astronomical Society;
abstract (resume) kan ses på ADS:
Bergmannn & Milvang-Jensen (2009).
Resume af projektet
Teksten skal oversættes:
The Sodium Na D absorption line at 5895 Angstroms is one of the strongest absorption
features in stellar photospheres, but has been rarely used in integrated light stellar
population studies of galaxies. A principal reason why it has not been used is the suspicion
that interstellar absorption within the galaxies may enhance or alter the absorption profile
of the combined stellar light, thus giving an errant description of the stellar population. As
a project undertaken during the National Virtual Observatory Summer School, we have
investigated to what extent ISM absorption seems to alter the measurements. We use VO
tools to create multiple galaxy samples: a sample expected to have little ISM (cluster
galaxies, which are mainly ellipticals), and two samples with higher expected levels of ISM
(HI-detected galaxies and morphologically late-type galaxies). After culling the samples to
match the same distribution of (older) ages and (higher) metallicities, we find that the Na
D vs. velocity dispersion correlation is not significantly different for the samples with and
without ISM, and all have similar levels of scatter. Consequently, the Na D line seems like
a promising tool for evolutionary studies comparing high and low redshift galaxy samples.
Baggrund og projektdesign
Teksten skal oversættes:
Galaxies are full of stars, and sometimes gas and dust too. The optical spectrum of a galaxy is the
composite sum of the emission from all its stars & hot gas, with possible absorption or extinction by its
dust and gas. We are interested in deriving the star formation and chemical enrichment history of
galaxies, and a common tool used is the study of stellar absorption lines (or line indices). The strongest
and most often studied features are the Balmer lines, the Mgb triplet around 5170 Angstroms, and
some Fe line features around 5200-5500 Angstroms. One very strong line which has not been much
utilized is the Sodium Na D doublet at 5895 Angstroms. While this is a very strong stellar absorption
line, it may also be absorbed (or emitted) by the ISM of the galaxy, and this potential contamination
has kept investigators from using it for stellar population analysis work in the past.
As part of the National Virtual Observatory (NVO) Summer School in September 2008, we designed
a project to test whether this concern about ISM influence on the stellar Na D line strength was
warranted. Using various NVO tools we constructed three galaxy samples: one composed of galaxies
expected to have no ISM (cluster galaxies), and two samples of galaxies expected to have ISM (an HI
selected sample, and a sample of late-type spirals). We would then compare correlations of Na D
strength and other observables between the samples, to see if Na D is a useful diagnostic tool.
Definering af 3 sæt af galakser
Teksten skal oversættes:
All galaxies must have SDSS spectra with S/N > 35 and velocity
dispersion 100 < sigma < 300 km/s (from DR4)
- Cluster Sample (expected to not have ISM): Choose all galaxies
within 1 Mpc of the center of any cluster in the C4 (Miller et al. 2005)
cluster catalog, using a cone search in the NVO and the STILTS tool.
Total ~700 galaxies.
- Late type spiral sample: Select all galaxies with concentration index
C > 0.4. C was derived in TOPCAT using the R50 & R90 radii from
SDSS DR4 extracted with CASJobs. Total ~500 galaxies.
- HI sample: Select all galaxies with an HI detection in the FIRST
survey, using openskyquery.net. Total ~700 galaxies.
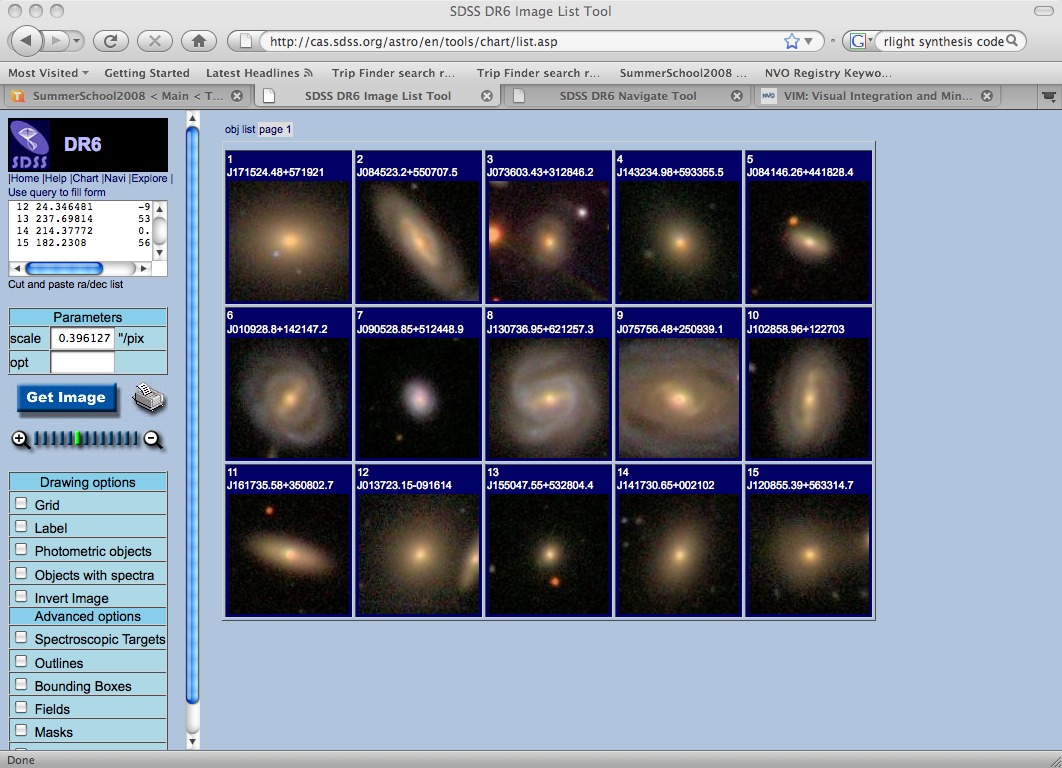
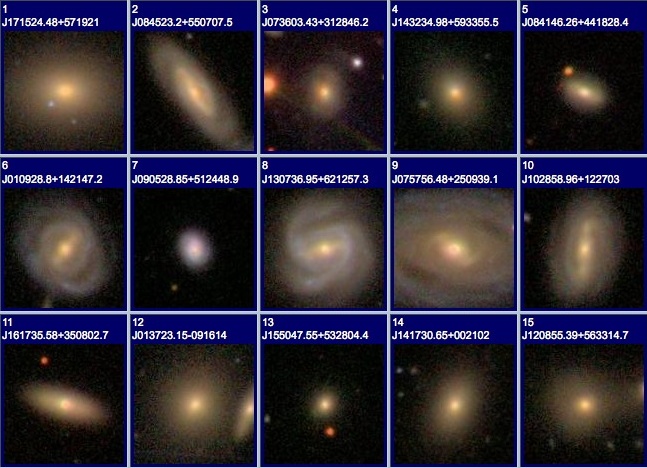
Nedenfor ses billeder fra SDSS af 5 eksempler fra hver af de 3 sæt.
Fra oven og ned viser de 3 rækker sæt nr. 3, 2 og 1.
Eksempler på galaksespektre
Teksten skal oversættes:
SDSS spectra of two galaxies from the sample, with the major spectral features marked.
Note the strong NaD absorption feature at restframe 5895 Angstroms.
Plots der sammenligner de 3 sæt galakser
(Some text is missing here, it wasn't in the tar file.)
Plot for alle galakser i de 3 sæt galakser (vist med hver sin farve).
x-akse: log(alder), hvor alder er i Gyr
y-akse: log(metalindhold)
Plot for de gamle og metalrige galakser i de 3 sæt galakser (vist med hver sin farve).
x-akse: log(alder), hvor alder er i Gyr
y-akse: log(metalindhold)
Plot for alle galakser i de 3 sæt galakser (vist med hver sin farve).
x-akse: hastighedsdispersion for stjernerne i galaksen, i km/s
y-akse: styrke af natriumabsorptionslinien
Plot for de gamle og metalrige galakser i de 3 sæt galakser (vist med hver sin farve).
x-akse: hastighedsdispersion for stjernerne i galaksen, i km/s
y-akse: styrke af natriumabsorptionslinien
Resultater
Teksten skal oversættes:
The NaD absorption strength correlates well with velocity dispersion (which is a proxy for mass).
Above, left, the full samples are shown, and above, right, are just the old, metal rich galaxies. All
three samples follow the same correlation. Restricting the age/metallicity reduces the scatter (as
expected).
We conclude that for comparative studies of samples of galaxies (say, high redshift vs. low
redshift), the NaD line is a useful indicator, not significantly affected by ISM absorption.
Referencer og nyttige links
Teksten skal oversættes:
- US Virtual Observatory Node: http://www.us-vo.org/
- TOPCAT and STILTS database handling & visualizing utilities: http://www.star.bris.ac.uk/~mbt/topcat/
- OpenSkyQuery catalog cross-matching tool: http://openskyquery.net/Sky/skysite/
- SDSS DR4: http://www.sdss.org/dr4/
- MPA/JHU value-added distribution for galaxies in DR4: http://www.mpa-garching.mpg.de/SDSS/DR4/
- Galazzi et al. (2005, 2006) age & metallicity measurements for DR4 galaxies:
http://www.mpa-garching.mpg.de/SDSS/DR4/Data/stellarmet.html
- SDSS DR7 image list tool: http://cas.sdss.org/astrodr7/en/tools/chart/list.asp
- Miller et al. (2005) C4 cluster catalog: http://www.ctio.noao.edu/~chrism/C4/
(We are grateful to C. J. Miller for providing an updated version of the catalog.)
- Becker et al. (1995, etc.) FIRST HI survey: http://sundog.stsci.edu/index.html
Tilbage til dette websteds forside
Bo Milvang-Jensen 2008-2009.
Page last updated: 12-May-2009